
Most people have heard the expression “you get what you measure”, and it doesn’t take much time observing behavior in the corporate environment to realize that this is very true. Well-thought-out performance metrics are critical in creating a productive work environment, and there is plenty of anecdotal evidence showing how various dysfunctional behaviors in the workplace can be traced back to poorly constructed or out-of-date performance metrics.
Shareholders certainly have common ways of measuring the performance of the companies they own, as they look to see quarterly earnings targets met, revenues growing, and expenses contained. Given the international nature of most businesses, the foreign exchange environment can obviously have a significant impact on these results, and yet these FX impacts are often poorly understood, both inside and outside the company.
Many companies with significant international exposures choose to hedge their FX risk with “cash flow” (FAS 133/ASC 815) hedges and/or “balance sheet” (FAS 52/ASC 830) hedges in order to reduce the volatility caused by FX. The term “cash flow hedging” is a bit of a misnomer, as cash flow hedges don’t necessarily cover the entire cash flow period. Cash flow hedges often cover a certain amount of time, up until forecasted revenues or expenses are realized and become receivables or payables, respectively. The final period between when revenues or expenses are realized and when the receivables or payables are eventually collected or paid is typically covered by a company’s balance-sheet hedging program. This paper focuses solely on the topic of cash flow hedging.
Cash flow hedges typically cover the items on the income statement that have far more accountability within the company compared to items covered by balance sheet hedges, since there is far less ownership of the balance sheet throughout the company, from a metrics standpoint. For this reason, the gains or losses from the cash flow hedges are more likely to be allocated to the various businesses and regions within the company, and therefore the need to understand the impacts goes well beyond the Treasury team. Since these hedging impacts often show up on the revenue and expense lines of the income statement, they become important for investors to understand as well.
THE EASY WAY OUT?
Before discussing some of the best practices in measuring the success of a cash flow hedging program, it’s worth noting that not all companies with significant international exposure do any hedging at all. The typical argument for this passive approach is that FX hedging is a zero-sum game, long term, and that they can guide their investors towards the true fundamentals of their business by providing “constant currency” analysis. This analysis typically takes the form of a year-over-year comparison based on foreign exchange rates being held constant from the previous year.
For example, a company might communicate on their quarterly earnings call that, even though revenue grew by only 3% year-on-year in US dollar terms (the actual GAAP results for the quarter), revenue grew by 7% year-on-year in constant currency terms. The 4% difference was due to the weakness of foreign currencies against the dollar (not an uncommon result for some companies recently, due to significant USD strengthening). The company is hoping that investors will look past the actual 3% result in USD terms and model future company growth based more on the 7% constant currency growth rate (though most of the time the true company growth rate probably lies somewhere in between the two percentages).
While providing constant currency guidance is better than providing nothing at all to investors, it still fails to reduce the volatility of the actual results, which could have been smoothed out with an effective cash flow hedging program. Investors in your company aren’t being compensated for taking on extra FX risk, and they don’t have the ability (or desire) to identify and hedge this risk on their own. Even if you make the zero-sum-game argument that FX impacts on cash flows over the long term will be a wash, the volatility of those cash flows matters as well. Higher earnings volatility increases the beta of any given stock, and the higher risk level depresses the stock price, all else being equal.
Companies that have decided to take on the challenge of hedging their cash flow exposures are faced with a number of decisions that are dependent on their specific business and corporate structure. FAS 133 has certain rules concerning the type of FX exposures that can receive hedge accounting treatment, and identifying where these exposures can be hedged depends on the functional currency setup of the companies’ international entities, inter-company billing relationships, the ability to forecast various items on the income statement, and many other factors. There is therefore no “one size fits all” approach to cash flow hedging, but, in coming up with the right strategy for your company, there are some best practices to consider.
DON’T “SET IT and FORGET IT”
Almost every company has an annual planning cycle, which typically requires assumptions as to the FX rates to be used in planning for the upcoming year. While this is a necessary starting point, most companies also have quarterly or even monthly updates to these annual plans, and the updates might be the “main” plans that really serve as the performance metrics for the company. If these updated plans don’t include changes in FX rate assumptions (as the initial assumptions can certainly go stale very quickly), then the company might find that any USD-based targets for their non-US regions (which are using stale FX rates to convert to USD) are either far too easy or far too difficult to meet.
Having local-currency-based targets for the international regions can solve the problem for their specific performance metrics (local-currency-based quotas that are set once per year might be a good idea for international sales teams, for example), but someone at the company still has responsibility for the USD equivalent plan, so the problem of stale FX planning rates still exists. Rather than dealing with the complexity of layering new FX rate assumptions into their updated plans, some companies choose just to hedge their entire year’s forecasted exposure at the time of the initial plan (typically a month or two before the year begins).
This is probably the easiest thing to do from an internal administrative perspective, but not really the best solution from an external market perspective, and, unless your FX exposures represent a very small percentage of your business, it is probably not a good way to go. Even though you have hedged your results for the year and can match these hedged rates with your planning rates for the entire year by using this approach, you have not smoothed out the impacts of FX over time. Instead, this approach creates an abrupt “staircase” type of FX rate impact from one year to the next, which is not compatible with how the markets your company is involved with are absorbing FX changes over time.
For example, if you were hedging forecasted EUR revenues, and your annual planning cycle concluded in March of each year (assuming a fiscal year that begins in April), you might have initiated hedges in March 2014 (maturing between April 2014 and March 2015) at a rate of 1.39. The following year you might have initiated hedges in March 2015 (maturing between April 2015 and March 2016) at a rate of 1.05. The longest-dated hedge executed at 1.39 would roll off in March 2015, immediately before the next hedge at 1.05 took effect, in April 2015.
The drop from 1.39 to 1.05 represents almost a 25% weakening of the EUR, which is a tremendous hit to take in consecutive months. While the company would have been thrilled with a 1.39 revenue hedge lasting as long as it did, the precipitous drop to 1.05 places immediate margin pressure that can’t realistically be offset in any way. The goal of cash flow hedging should be to buy enough time to adequately deal with any shocks in the FX markets and help smooth out the results accordingly. The immediate drop from a 1.39 hedge to a 1.05 hedge doesn’t accomplish this, as the businesses customers certainly would not be able to absorb any attempts to offset this with a 25% EUR price increase in one month, so far removed from the initial EUR weakening.
UNDERSTANDING THE LAYERS
Rather than potentially buying more time than you probably needed with the last 1.39 hedge and buying less time than you needed with the first 1.05 hedge, a layered approach is usually the better way to go and provides far smoother results. As mentioned earlier, however, this approach does require that Treasury team partner effectively with Financial Planning and Analysis (FP&A) in updating the planning cycles and also with whomever is providing specific forecasts and being allocated cash flow hedging FX gains or losses.
It is insufficient for FX risk managers to provide merely the cash flow hedging FX gain or loss details, without also including how these details fit in with the overall plan. They must also provide the analytic details that build the bridge back to the plan that their business partners understand and for which they are accountable. FX risk managers must work with FP&A in updating and communicating a rolling set of planning rates that keep up with the updated rolling targets for the company. They must also help explain the inevitable deltas between these forecasted plans and the actual results with the hedging included. These inevitable deltas are either volume driven or rate driven, and the details of these impacts must be understood.
Volume drivers come not only from pure forecast deviation, but also from the common cash flow hedging strategy of hedging less than 100% of the forecasted exposure. This is often the case, due to the desire to maintain hedge accounting treatment, which can be put at risk from frequent over-hedging. Everyone therefore must understand both the accuracy of the forecasts and the impact of the unhedged forecast (which is the difference between the planning rates and the eventual accounting rates, multiplied by the percentage not hedged per policy).
On the rate side, the hedges don’t perfectly offset the difference between the planning rates and the eventual accounting rates at maturity if the hedges are not executed at the planning rates. The best practice of updating the planning rates with the rolling planning cycle can reduce these deltas, but does not necessarily eliminate them. The best FX rates for you to provide when planning for future quarters should include the actual hedges already in place for those quarters and also typically an estimate for the hedges that have not yet occurred. Whatever assumptions are made (current spot rates or forward rates are just as good assumptions as any) will ultimately be inaccurate, and this contribution to the noise must be tracked.
Below is an example of a dashboard that incorporates these drivers.
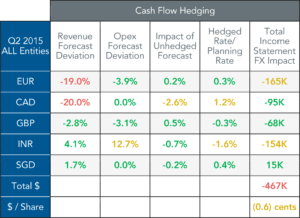
Green-yellow-red dashboards are particularly helpful in improving forecasts over time, as no one wants to have a color other than green associated with a forecast they have responsibility for. Forecast providers must know when their forecasts deviate substantially from the actual results, even when the impact isn’t harmful to the bottom line (which depends upon FX movements that are out of their control). Converting the total impact on the income statement to a pennies-per-share (or fraction thereof) metric can be helpful in the preparation for a quarterly earnings call in the cases where FX impacts are material enough to be discussed on these calls.
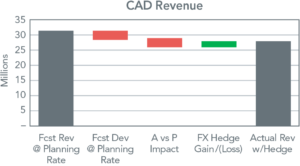
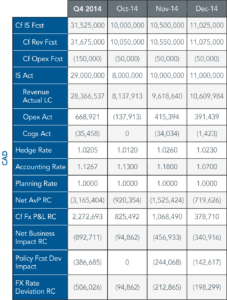
The next two charts isolate Canadian dollar revenue and the bridge from revenue at the planning rate to the actual revenue realized at the future accounting rates with hedging included. The first chart is a high-level waterfall chart, while the second provides the drilled down numbers that explain all the volume-driven and rate-driven deltas.
Conclusion
As with any other type of performance, when it comes to that of cash flow hedging programs, you get what you measure. Without proper metrics in place, those in charge of cash flow hedging might do a poor job of mitigating FX risk for their companies. Companies should not be speculating on the direction of exchange rates, attempting to maximize profits if currencies move in the “predicted” direction. Nor should they purely minimize their administrative burden, ignoring the impact that an overly simplistic hedging approach might have on their competitiveness in predictable scenarios.
A good cash flow hedging strategy is one that minimizes the amount of pain across widespread currency strengthening or weakening scenarios, buying enough time to react to competitive shifts while smoothing out the impacts on the income statement. This strategy must be well understood by all stakeholders and well-integrated into the company’s planning cycles, with frequent feedback provided by Treasury on what might be causing unnecessary volatility. It is up to the FX risk manager to develop and maintain the right business contacts, keeping a pulse on any changing business models or strategies in order to ensure the success of the cash flow hedging program into the future.
About the Author
Scott Bilter, CFA
Scott has held a number of executive positions with Hewlett Packard, including VP of Corporate Finance and Foreign Exchange, and VP of Worldwide Financial Planning and Analysis. He holds a BA in quantitative Economics from Stanford University, an MBA in Finance from the Anderson School at UCLA, and the Chartered Financial Analyst designation.
Disclaimer
The information contained in this publication is provided for information purposes only. The information contained herein has been obtained or derived from public sources believed to be reliable, but we do not represent that it is accurate or complete and should not be relied upon as such. Any opinions or predictions constitute our judgment as of the date of this publication and are subject to change without notice.
All rights reserved. Please cite source when quoting.