FX Execution Cost: How Trade Size Drives What You Pay
How Much to Show at Once
Why trade size, your bank’s pricing engine, and your accounting rate all shape FX execution cost
FX execution cost has two great levers: when you trade, and how much you show at once. The second lever is trade size: the size you reveal in a single request drives your cost through three channels: the bank’s pricing engine, the information you give away, and how close you finish to your accounting rate.
FX execution costs rise with size, past a point that depends on the pair
Every currency pair has an absorption limit: the notional size a dealer can take on before pricing tightens. Below it, quotes are competitive; above it, cost climbs as the dealer prices in the risk of laying the position off. That limit is highly pair-specific: a deep major (a high-volume pair like EUR/USD or USD/JPY) can absorb a large ticket without moving price, while a thinner emerging-market pair reaches its threshold far sooner.
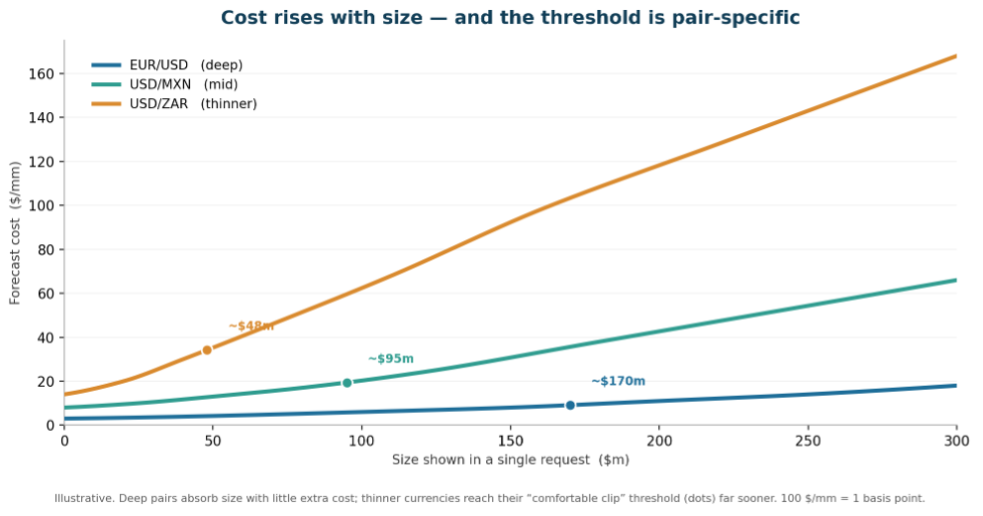
A size routine in EUR/USD can be a market-moving order in USD/ZAR. There is no single threshold that applies across pairs. Knowing roughly where each pair’s limit sits is the starting point for deciding whether to show a trade in one clip or several.
The bank’s pricing engine: auto vs manual
Most banks price FX in two modes. Up to a per-currency notional threshold, a request is handled by the bank’s pricing engine, quoted electronically, automatically, at a price set by the bank’s algorithm rather than a human trader. Above that threshold it routes to a human trader, who prices it manually and adds margin for the handling and risk a larger or less standard ticket carries. As a rule, a request that fits inside the auto-pricing band is quoted tighter and faster than the same notional shown as one large manual ticket.
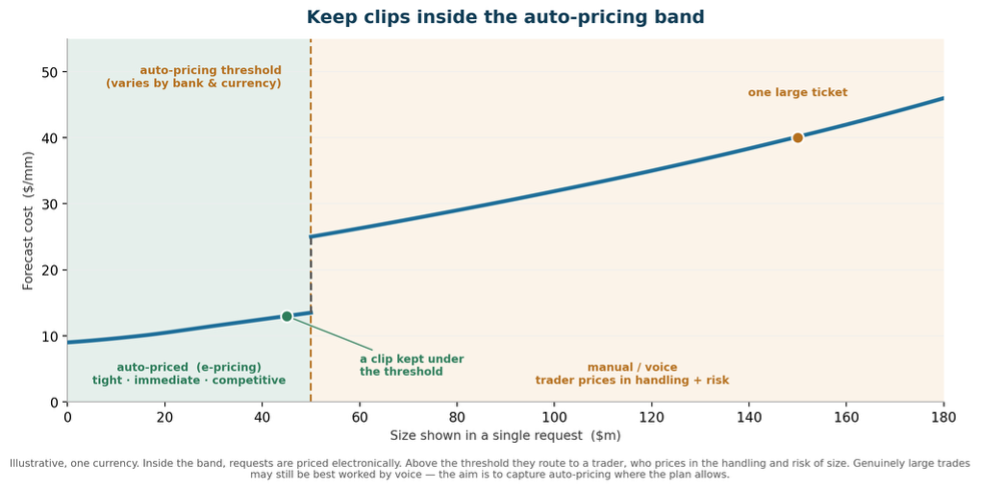
Where the plan allows, sizing clips to stay inside the auto-pricing band captures the tighter electronic quote. The caveat matters: thresholds vary by bank, currency and conditions, and a genuinely large order is often still best worked by voice rather than chopped into many small clips that together signal a bigger intent, which is where the next two costs come in.
Showing size gives information away
Every request reveals something. Show a large order to one dealer or several, and you hand over information about your intent; dealers can adjust and pre-hedge, and the price can move away from you before you finish. The effect grows with the size you show at once and with the number of dealers you show it to. Slicing helps because it reduces the size revealed at any single moment, but only up to a point, because slicing carries costs of its own, which is the heart of the trade-off below.
The benchmark that actually matters: your accounting rate
For a fund manager, the benchmark might be a market fixing. For most corporate treasuries it is something more specific: the accounting rate. This is the FX rate your ERP and accounting systems use to translate transactional-currency balances back into your functional and reporting currency, typically a defined month-end or time-of-day market snapshot. Under IAS 21 and ASC 830, monetary balances are revalued at that rate, and any difference between the rate you actually execute at and the accounting rate flows straight through the P&L as an FX gain or loss.
That changes what “shortfall” means. For a corporate treasury, shortfall is not slippage versus mid. It is the gap between your execution rate and your accounting rate. And that gap is driven far more by where the market moves than by the spread you pay: a half-percent move between execution and the accounting snapshot is 50 basis points (5,000 $/mm), dwarfing a bid-offer of a few to a few tens of $/mm. For flows benchmarked to the books, staying close to the accounting rate usually matters more than shaving the spread.
Putting it together
The three channels pull in different directions. Auto-pricing and information leakage both reward smaller clips. Shortfall against the accounting rate rewards executing close to the snapshot, which, done all at once, concentrates the trade into a single, often congested moment (the very fixing window Part One of this series flagged as expensive) and can breach the auto-pricing threshold. The right clip size sits in the middle: small enough to stay inside the auto-pricing band and limit what you reveal, scheduled tightly enough around the accounting snapshot to keep tracking error under control.
As illustrative orders of magnitude (100 $/mm = 1 basis point): keeping a clip inside the auto-pricing band rather than forcing one large manual ticket can be worth a few $/mm in deep pairs and tens of $/mm in thinner ones; the leakage avoided by not over-showing size is of similar scale; but the shortfall against the accounting rate, when the market moves, can be an order of magnitude larger than either. Control shortfall first, then capture auto-pricing and limit leakage within that constraint.
Key takeaways
- Cost rises with size past a pair-specific threshold; a routine size in a major can be a market-moving order in an emerging-market pair.
- Most banks price tighter inside an auto-pricing band and wider above it; sizing clips to stay in the band captures the better price.
- Showing size leaks intent: the cost grows with the size shown and the number of dealers shown it.
- For most corporates the real benchmark is the accounting rate, the ERP revaluation snapshot, so shortfall is the gap to that rate, and market moves there can dwarf the spread.
- Size and schedule each clip to balance auto-pricing, leakage, and shortfall against your accounting rate.
References & further reading
- Almgren, R., & Chriss, N. (2000). Optimal execution of portfolio transactions. Journal of Risk, 3(2), 5–39.
- Bank for International Settlements (2020). FX execution algorithms and market functioning. Markets Committee, October 2020.
- Bank for International Settlements (2025). The FX trade execution landscape through the prism of the 2025 BIS Triennial Survey.
- BIS Quarterly Review, December 2025.
- International Accounting Standards Board, IAS 21, The Effects of Changes in Foreign Exchange Rates; and FASB ASC 830, Foreign Currency Matters.
- Obizhaeva, A. A., & Wang, J. (2013). Optimal trading strategy and supply/demand dynamics. Journal of Financial Markets, 16(1), 1–32.
- Perold, A. F. (1988). The implementation shortfall: Paper versus reality. Journal of Portfolio Management, 14(3), 4–9.
This is Part Two of Optimizing FX Execution for Corporations. Part One covers timing; Part Three covers choosing the bank panel. Illustrative figures throughout; actual costs vary by currency, trade size, and prevailing market conditions. 100 $/mm = 1 basis point. Informational only, not investment advice.